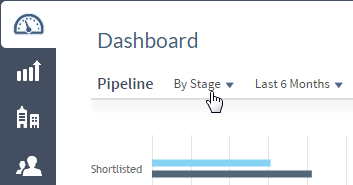
When you display the Pipeline chart in the Dashboard area, you can break down the estimated and weighted revenue amounts along the vertical axis based on any of a number of opportunity-related fields (for example, by primary client,
project manager, market, or stage).
The dimension selections include all standard and custom fields for opportunities that have a lookup list or drop-down list of values. In addition, a
By Month option enables you to display a month-by-month breakdown of revenue for the time frame you select for the chart.
To select a dimension for the vertical axis of the Pipeline chart, complete the following steps:
-
Click
 to go to the Dashboard area.
-
Click the currently selected dimension above the upper-left corner of the chart.

-
In the drop-down list, click the dimension you want for the vertical axis.
 to go to the Dashboard area.
