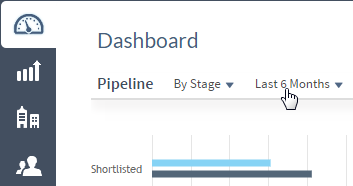
When you display the Pipeline chart in the Dashboard area, you can specify the time frame for which you want to see the estimated and weighted revenue.
iAccess spreads the revenue amounts for each opportunity evenly across the period from that opportunity's start date to its end date to determine per-day estimated and weighted revenue. It then uses the opportunity start and end dates to determine the number of days each opportunity will contribute revenue during the Pipeline chart time frame you select, and multiplies that number of days by the per-day revenue amounts to determine the revenue contributed.
Note: Because a start and end date and an estimated revenue amount are required for the calculation of pipeline revenue amounts, the chart excludes opportunities that do not have all three of those values.
To select the time frame for the Pipeline chart, complete the following steps:
-
Click
 to go to the Dashboard area.
-
Click the currently selected time frame above the upper-left corner of the chart.

-
In the drop-down list, click the time frame you want.