Lesson 2: Take a closer look at billing and productivity
Learn how to use Ajera to help you review the state of your firm's billing and productivity.
| Start here! | See which projects need your attention |
| Review billing | |
| Forecast your near-term income | |
| Review employee utilization | |
| Review employee productivity | |
| Test your knowledge |
See which projects need your attention
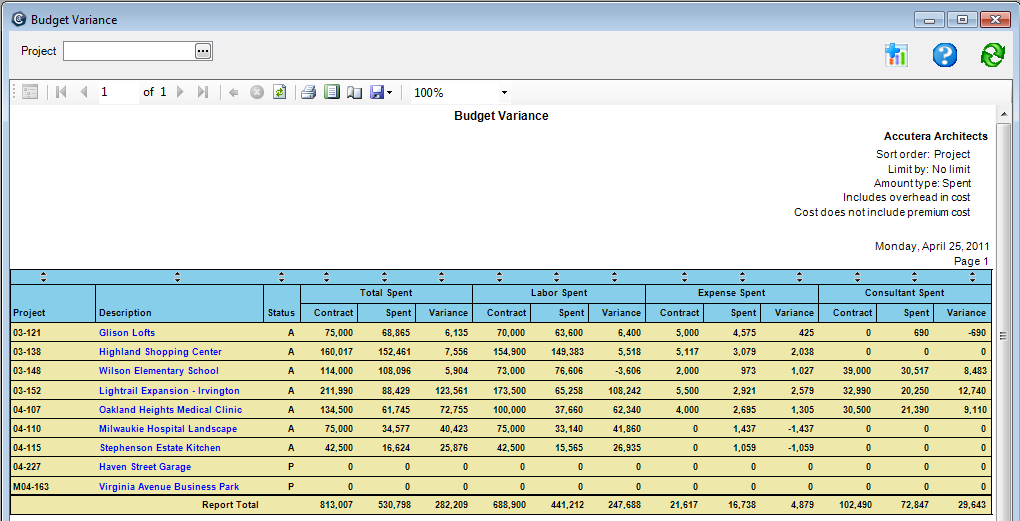
Use the Budget Variance report to monitor labor, expense, and consultant totals.
Use the graph view to see, at a glance, which projects need your attention. The comprehensive budget information on the report includes contract amount, amount spent, and amount remaining for labor, expenses, and consultants.
You can summarize information by project manager, principal in charge, project type, or department. You can drill down to project and phase information.
Where to see it
From the Reports menu, click Project > Budget Variance.
What it looks like
Review billing
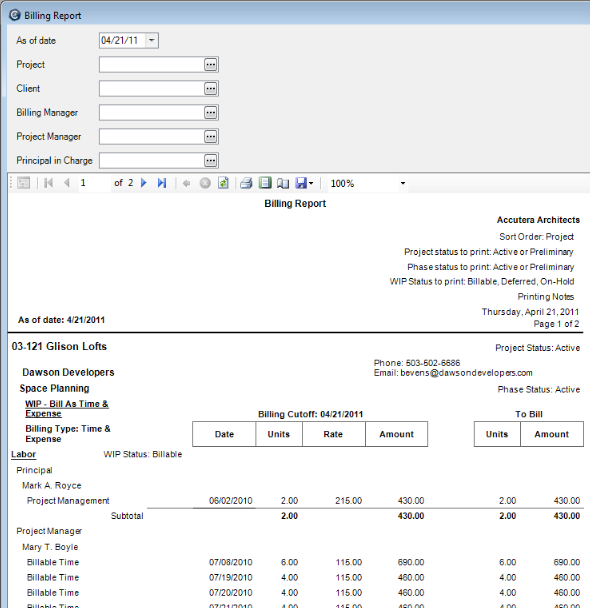
Use the Billing report to make informed billing decisions. Improving the turnaround on invoices helps improve cash flow.
Preview potential billings by looking at the project summary or reviewing every billable item on each project. Use the report as a worksheet to adjust billable items and to note percent and amounts to bill for fee type invoices.
The report shows a summary of contract amounts, prior billed, and current WIP (work-in-progress) amounts by project and phase along with detail of all unbilled WIP. It shows contact information such as client, phone number, and email address. It also shows reported percent complete to assist in the billing decision.
You can summarize by billing manager, principal in charge, project type, or department. You can drill down to project, phase, and full unbilled detail information.
Report totals
include only projects and phases that have outstanding WIP. If you want report
totals to include all projects and phases, click  (Customize), and select Print
phase summary.
(Customize), and select Print
phase summary.
Where to see it
From the Reports menu, click Project > Billing Report.
What it looks like
Forecast your near-term income
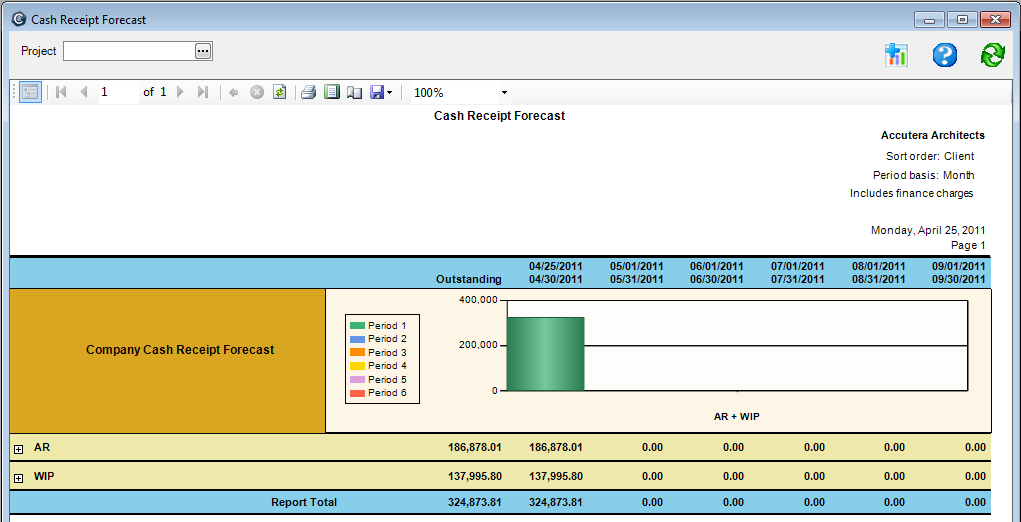
Use the Cash Receipt Forecast report to forecast your near-term income and review any discrepancies between planned and actual cash receipts.
This report displays expected cash receipts for each of the next six weeks, months, or quarters from the date you print the report. You can produce the report for either all projects or just one selected project.
At a glance, the report shows the period totals for expected cash receipts and a bar chart of those totals. You can drill down on Accounts Receivable and Work-in-progress totals to view bar chart summaries and corresponding detail.
How forecasts are calculated
The AR Cash Receipt Forecast is determined by collecting all outstanding client invoices and projecting a cash receipt date based on the client's average days-to-pay. When an invoice is outstanding for a new client, days-to-pay are based on a company average.
The WIP Cash Receipt Forecast is determined by collecting all outstanding WIP and first projecting an invoice date based on how quickly a transaction is invoiced on average for the company. The cash receipt date is then projected based on the client's average days-to-pay. If the client average cannot be determined, a company average is substituted.
For both AR and WIP, when the projected cash receipt date is earlier than the date you are printing the report, amounts appear in the first period in bold red.
| Note: | When the average days for a client to pay an invoice goes beyond the range of the six periods being displayed, the outstanding amount does not add up to the totals of the six periods. |
Where to see it
From the Reports menu, click Client > Cash Receipt Forecast.
What it looks like
Review employee utilization
Review employee utilization
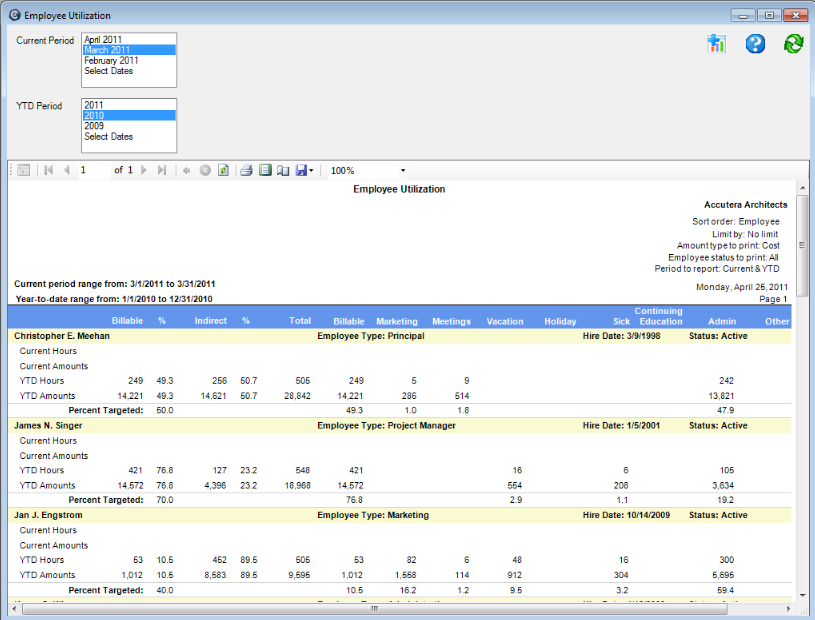
Use the Employee Utilization report to review employee productivity. You can monitor the ratio of billable-to-nonbillable time for each employee, and compare actual billable hours with budgeted hours and the targeted billable percent. You can also see how employees are spending their nonbillable time.
An employee’s billable time that is written off is still considered as billable for the employee’s utilization calculations because this time was spent working on a billable activity even though you are unable to bill it to your client.
This report shows:
- Information for a current period and year-to-date that you define.
- Hours and/or amounts (cost or spent) for direct (billable) and indirect (nonbillable) time.
- Percentages and targeted percentages.
Where to see it
From the Reports menu, click Employee > Employee Utilization.
What it looks like
Review employee productivity
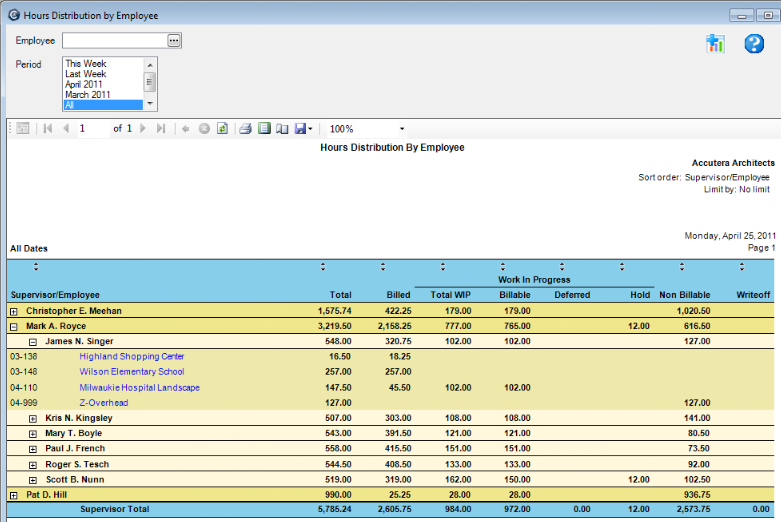
Use the Hours Distribution by Employee report to review employee time worked on projects and employee productivity. This multipurpose report allows visibility to each supervisor’s employees and to details about the hours that they worked.
You can start with a summary of total hours by supervisor and drill down to the specific details of an employee’s time spent. Define the period you want to report: this week, last week, the month, and so on.
This report shows all the hours entered on timesheets by employees.
You can summarize the information by supervisor or employee and drill down to employee time.
Where to see it
From the Reports menu, click Employee > Hours Distribution by Employee.
What it looks like
Learn the details
These links go to help. To return to this course, click the Back button.
Hours Distribution by Employee report
Test your knowledge
Quiz: Billing and productivity
Next