SmartGantt Chart
In the Activity view, on the right side of the S1 // Projects tab screen, the project displays as a Gantt chart, called a SmartGantt.
The Gantt chart view allows you to view metric results, activity progress, uncertainty settings, or modification such as activity acceleration, directly on the schedule.
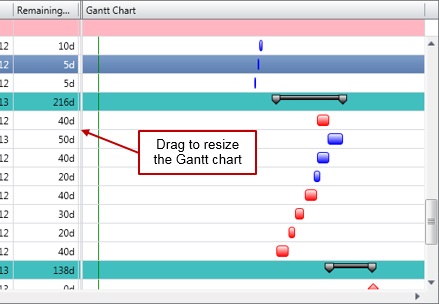
You can resize the Gantt chart by clicking on the left hand border of the Gantt column header and dragging to the left/right.
Top and Bottom Activity Bars
The SmartGantt can display a single bar (top bar) for each activity or two bars for multiple activity attributes. You can also set different options for each bar.
SmartGantt Options
The SmartGantt options allow you to specify how the top and bottom bars display. You can access them from the SmartGantt drop-down menu or by using the SmartGantt Configuration dialog box.