S2 // Diagnostics Tab Views and Commands
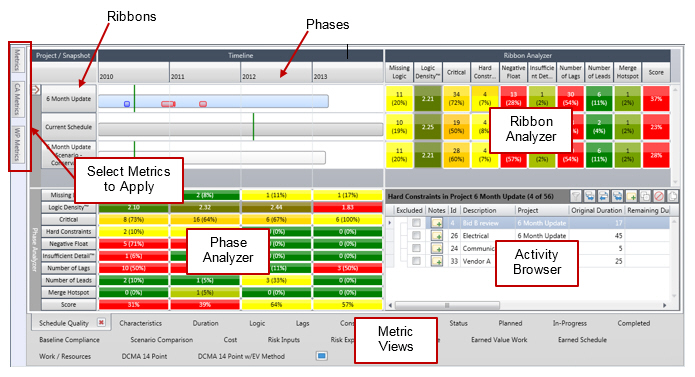
This tab includes ribbons and phases, an activity browser, and ribbon and phase analyzers.
You can use your mouse to hover over a metric and view the metric description in the tool tip. You can edit or add to these descriptions using the metrics Description field on the Metrics tab.

| Field | Description |
|---|---|
| Ribbons | Ribbons are groupings of activities based on a given criteria. |
| Phases | Phases are user-definable 'segments' of time against which an Acumen Fuse analysis is run. |
| Ribbon Analyzer | The ribbon analyzer shows the results from an analysis for each ribbon. |
| Phase Analyzer | The phase analyzer shows the results from an Acumen Fuse analysis for each phase. |
| Activity Browser | The Activity Browser lists specific activities based on a given criteria. The grid header displays in parenthesis the number of records that tripped the metric as well as the number of records evaluated by the metric. The records may be activities, work packages, or control accounts, depending on the metric. |
| Metric Views |
By default, this tab is automatically populated with multiple sub-tabs containing separate views for each of the metric libraries. You can edit each of these views with regards to adding/removing metrics to each of the three analyzers (ribbon, phase, intersection). |
| Select Metrics to Apply | Use these tabs to add metrics to one or more of the analyzers. You can edit, add, or remove metrics on the Metrics tab. |
- Related Topics:
- Ribbon Commands on the S2 // Diagnostics Tab
Use the ribbon commands to pinpoint and resolve schedule shortcomings.
Parent Topic: S2 // Diagnostics Tab