Ribbon Browser
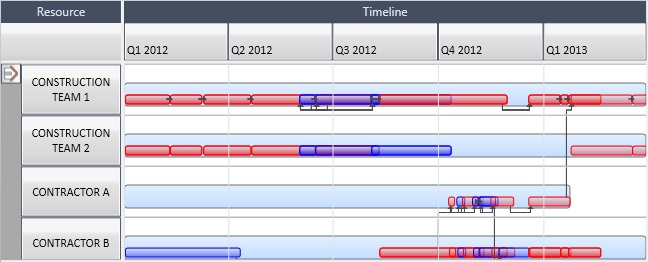
Within the ribbon browser, you create ribbons, segment by phases, and apply metrics.
The ribbon browser is the core of the diagnostics tab and is highly customizable.
| Feature | Description |
|---|---|
|
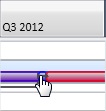
Click on a section of the ribbon to see the associated activities in the Activity Browser. |
|
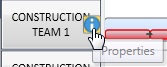
Double-click the ribbon name to drill down. Click
Hover over the ribbon name then click the Properties icon to view additional information. |
|
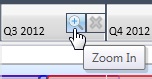
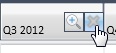
Hover over a date header then click the magnifying glass that displays to zoom into that year, quarter, month, and so on. |
|
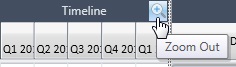
Hover over the Timeline header then click the magnifying glass to zoom out to the next level. |
|
To remove a time period, for example, a quarter, from the ribbon browser pane, hover over the column header then click the X that displays. |
