The Activity Browser Display
The area where you click in the S2 // Diagnostics tab pane determines the activities that display in the Activity Browser.
Activities Irrespective of Tripwire Threshold
| Action | Analysis View | Activity Browser Results |
|---|---|---|
| Click on a ribbon description. | 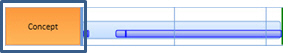
|
The Activity Browser displays all activities for the selected ribbon. |
| Click on a Phase header. | 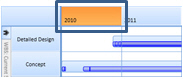
|
The Activity Browser displays all activities for the selected phase. |
| Click on a ribbon/phase intersection. | 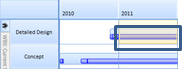
|
The Activity Browser displays all activities for the selected intersection. |
Activities That Trigger a Given Tripwire Threshold
| Action | Analysis View | Activity Browser Results |
|---|---|---|
| Click on an intersection metric. | 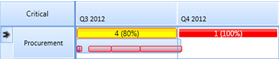
|
The Activity Browser displays the activities for the selected intersection that triggered the tripwire. |
| Click on a ribbon analyzer cell. | 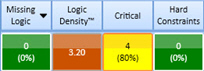
|
The Activity Browser displays the activities for the selected ribbon that triggered the tripwire. |
| Click on a phase analyzer cell. | 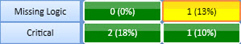
|
The Activity Browser displays the activities for the selected phase across all ribbons that triggered the tripwire. |
Activity Browser Modes
The Activity Browser can display activities in tabular, heat map, Gantt chart, scorecard, or detailed format.