Risk Sensitivity
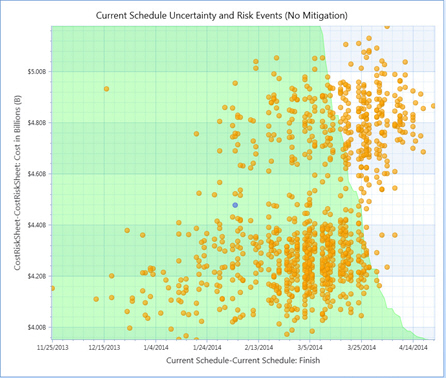
You can use the Risk Sensitivity™ chart to evaluate the relationship between durations and/or costs by creating a scatter chart showing their interaction.
The Risk Sensitivity chart includes several values and views:
- The Deterministic Value displays as a blue marker on the chart. Use the Deterministic value check box to turn it on or off.
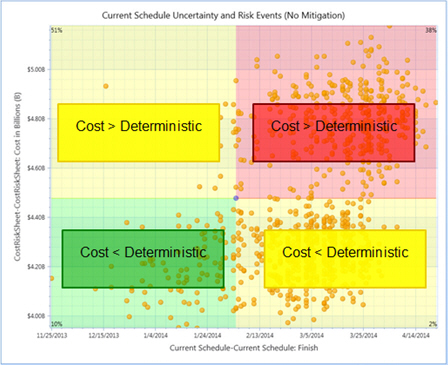
- Deterministic Quadrants provide further insight into the probability of meeting deterministic durations and/or costs. Use the Deterministic Quadrants check box to add/remove the quadrants from the chart.
- The
Joint Confidence Level (JCL) curve provides insight into the probability of meeting cost and schedule commitments. It displays the combined probability of both axis, for example, Cost and Finish Date, at any P-Value.
You can turn the JCL view on or off, as well as set the P-Value for the JCL curve, using the Joint Confidence Level (JCL) field at the bottom of the chart.
- The Configure button return you to the configuration screen to enter new values.
Risk Sensitivity chart Deterministic Quadrants Example
This example shows a Risk Sensitivity chart where the X-axis is Finish Date and the Y-Axis is Cost. The top left quadrant shows that during the analysis, 51% of the time, Cost was greater than deterministic while the Finish Date was earlier.
Risk Sensitivity Chart Joint Confidence Level Example
This example shows a Risk Sensitivity Chart displaying Joint Confidence Level (JCL)