Risk Sensitivity Report
You can use the Risk Sensitivity™ report to evaluate the relationship between durations and/or costs by creating a scatter chart showing their interaction.
The Risk Sensitivity report includes several values and views:
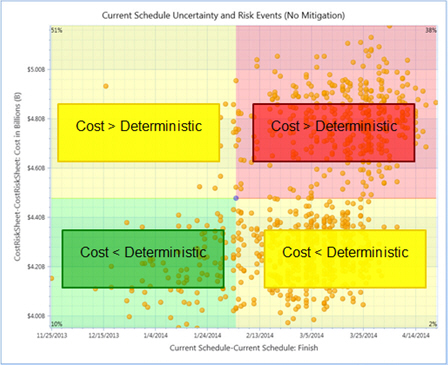
Risk Sensitivity Report Deterministic Quadrants Example
This example shows a Risk Sensitivity report where the X-axis is Finish Date and the Y-Axis is Cost. The top left quadrant shows that during the analysis, 51% of the time, Cost was greater than deterministic while the Finish Date was earlier.

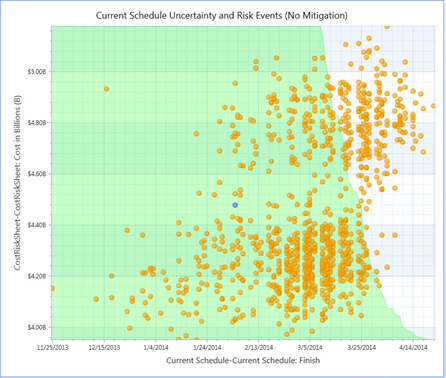
Risk Sensitivity Report Joint Confidence Level Example
This example shows a Risk Sensitivity Report Showing Joint Confidence Level (JCL)
